
Building the Business Case for Kubernetes Optimization
How to build a Kubernetes optimization business case that gets executive approval. Three-bucket ROI model (cost, performance, productivity), a 5-slide deck template, and the pitfalls that derail proposals.
THNKBIG Team
Engineering Insights

Introduction
If you're a CTO, VP of Engineering, or Platform Lead trying to get budget approved for Kubernetes optimization work, you've probably noticed that the conversation rarely starts with engineering. It starts with the CFO asking why your cloud bill grew 40% year-over-year, or the board asking why the infrastructure line on the P&L is climbing faster than revenue. By the time you sit down to write the business case, you're not just proposing technical work — you're responding to a financial question that's already been asked.
That tension is exactly why most Kubernetes optimization pitches fail. The team knows the work is worth doing. Right-sizing workloads, tuning autoscaling, eliminating zombie resources, consolidating clusters — these are well-understood engineering practices. But when the proposal lands in front of an executive audience that controls the budget, it gets reduced to a single question: what does this save, and how soon? If the answer doesn't show up cleanly in a financial frame, the work gets deferred another quarter.
This article is built for that moment. It's not a vendor pitch for a specific cost-optimization tool, and it's not a general "Kubernetes is complex" explainer. It's a practitioner's guide to building the business case for Kubernetes optimization — the kind of case that gets approved, not the kind that gets politely tabled.
We cover the three-bucket ROI model (cost, performance, productivity) that goes beyond what vendor content typically covers, realistic benchmarks for each bucket with the caveats executives will ask about, a five-slide deck template you can use to build the case this week, and the pitfalls that derail otherwise good proposals.
The goal is for you to finish reading with a business case draft that's roughly 70% complete — not a generic framework, but the actual structure you'd hand to your CFO.
1. Why Kubernetes Optimization Needs a Business Case
Kubernetes optimization is one of those categories of work that's universally understood to be valuable and almost universally difficult to fund. Engineers know that over-provisioned clusters waste money. CFOs and boards see infrastructure spend as a line item that's growing faster than it should. The gap is not technical — it's translation.
Most internal proposals read like engineering documents with financial headers stapled on. They list the technical wins: reduced over-provisioning, better autoscaling, fewer zombie resources, improved utilization metrics. Those wins are real, but they don't connect to the financial vocabulary executives use to make capital allocation decisions. When the proposal says "we'll improve cluster utilization from 22% to 65%," the CFO hears "we want to spend six months changing infrastructure so that a metric we've never tracked gets better." That's not a case. That's a wish.
A real business case does three things the typical proposal doesn't:
- Quantifies opportunity in financial terms, not infrastructure metrics. Utilization percentages are inputs to a financial model, not outputs. The output is "we project $X in annual run-rate savings with Y payback period."
- Acknowledges what the work doesn't deliver, because executives who have been burned by optimistic engineering projections trust proposals that name their own limitations.
- Names the cost of inaction, which is the part most proposals skip. Doing nothing is also a decision, and it has a cost trajectory that's easy to model.
The cost-of-inaction framing is usually where business cases get approved. The CFO isn't deciding between "do this optimization project" and "do nothing" — they're deciding between "do this optimization project" and "accept continued infrastructure cost growth as a strategic fact." Naming that second option, with numbers, reframes the decision.
There's a secondary reason the business case matters even with executive trust: the optimization work almost never survives a leadership change without one. The new VP inherits the cluster, sees the spend, and either restarts the conversation from scratch or kills the practice entirely. A documented business case with the original ROI assumptions, the actual delivered savings, and the post-optimization cost trajectory is the artifact that lets the work survive turnover.
The framework in the next section is the structure I've seen work best for this kind of proposal. It is deliberately not a vendor framework — it's the way consulting engineers and platform leads who have done this work multiple times actually structure the conversation.
2. The Three ROI Buckets: Cost, Performance, Productivity
Vendor content about Kubernetes optimization tends to lead with a single number: percent of cloud spend you'll save. That number is real, but it's also the smallest of the three buckets that actually matter. The full opportunity has three components, and understanding them is what separates a proposal that gets approved from one that gets politely tabled.
The three buckets
Cost. Direct infrastructure spend reduction: rightsized workloads, eliminated zombie resources, better autoscaling, reserved/committed-use planning, spot instance adoption where appropriate. This is the bucket vendor content lives in. It's also the most visible to executives because it shows up on the cloud bill.
Performance. Latency, reliability, scale-on-demand. Engineering metrics translated to business outcomes: transactions per second during peak, p99 latency against SLAs, uptime against contractual commitments, ability to handle Black Friday-scale traffic without manual intervention. Performance gains usually show up as avoided cost (penalties, churn, outages) rather than direct savings, which makes them harder to quantify but no less real.
Productivity. Engineer time freed from operational toil. Capacity planning, node patching, version upgrades, debugging configuration drift, firefighting the cluster because someone deployed with the wrong requests/limits. Every hour an engineer spends on platform toil is an hour not spent on the product work that drives revenue. Most organizations undercount this bucket because it's diffuse — no single ticket captures it, no single dashboard shows it — but it is consistently the largest of the three in organizations that have measured all three.
Why most proposals lead with cost (and why that's a mistake)
Cost is the easiest bucket to quantify (cloud bill, line items, defensible model). Performance is harder — you have to model avoided outages. Productivity is hardest of all — you're estimating engineer hours, and executives tend to discount soft estimates. Most proposals lead with the only number they can defend, leave performance and productivity to a sentence or two at the end, and get read as a "save 30% on the cloud bill" project. When the bill comes in 20% lower next quarter (still real savings), the proposal is judged a partial success even though the productivity gains — usually larger — were never measured or credited.
A business case that names all three buckets up front, sizes them roughly, and commits to measuring them after the work is done, gets read differently. It's not "save money on the cloud bill." It's "fundamentally change how engineering time gets spent and how the platform supports the business."
How to think about the three buckets together
The three buckets compound rather than substitute. A typical mid-sized deployment (50-200 nodes, multi-cluster, mix of stateless and stateful workloads) will see meaningful movement in all three buckets within 6-9 months if the work is done with discipline. Cost savings in the 20-40% range are common but not universal. Performance gains depend heavily on starting state. Productivity gains are almost always the largest in absolute dollar terms, because a senior platform engineer's fully-loaded cost is roughly $200-300K/year and freeing even half of one FTE-equivalent is worth more than most cost savings projects.
The rest of this article sizes each bucket with the caveats executives will ask about, then gives you the structure to put it on paper.
3. Cost Optimization: What Realistic Savings Look Like
Most vendor pitches on Kubernetes cost optimization lead with a single number, usually somewhere in the 40-60% savings range, attached to a customer logo and a case-study anecdote. The numbers aren't wrong, but they're selected. The honest range for cost-only optimization across a typical mid-sized deployment is closer to 20-40%, and the variance is wide because starting state matters more than methodology.
A cluster running at 8% CPU utilization with most workloads requesting ten times what they need has more cost headroom than a cluster that's already at 35% utilization with sane requests/limits. That's not a flaw in the work — it's a feature of arithmetic. The cost optimization project for the first cluster is closer to a clean-up than an optimization. The cost optimization project for the second cluster is closer to a refinement. Both are worth doing; the savings percentage is not a vendor scorecard.
For a business case, the honest framing is: expect 20-40% run-rate reduction on Kubernetes-attributable cloud spend, with the higher end achievable only when the starting state has significant over-provisioning. Most engagements land in the 25-35% band. Below 20% usually means the cluster was already well-tuned and the remaining opportunity is in tooling and process, not infrastructure. Above 40% usually means significant prior over-provisioning or a workload mix that doesn't need its current footprint.
A worked example, anonymized: a financial-services contact-center platform running ~120 nodes across three clusters was spending roughly $280K/month on Kubernetes-attributable infrastructure at the start of the engagement. After six months of disciplined rightsizing, autoscaling tuning, and consolidating underused workloads, run-rate spend dropped to roughly $190K/month — about 32% savings. The work also surfaced roughly $40K/month in non-Kubernetes waste (idle load balancers, orphaned storage volumes, dev clusters left running after hours) that the optimization process naturally cleaned up. Total impact: closer to 45% on Kubernetes-attributable spend when the adjacent waste is included.
The CFO-friendly translation matters here. A 32% savings on $280K/month run-rate is roughly $90K/month — $1.08M annualized. At a typical 6-month payback period on the optimization engagement itself (assuming external help at $150-250K, or fully internal cost for a 2-engineer team for 4-6 months), the project pays back in under half a year and runs positive from month seven forward.
Vendor consolidation is the second lever. Most organizations running Kubernetes at scale have at least three cost layers: compute, observability tooling, and a security/compliance overlay. Optimization work typically surfaces one or two tools in each layer that are doing overlapping work. We've seen engagements where consolidating from four observability tools to two paid for the entire optimization engagement on its own, before any infrastructure rightsizing.
The framing to put in the business case: cost optimization isn't a one-time project that delivers a percentage and stops. It's a discipline that, applied for 6-12 months, delivers a run-rate reduction and establishes the practice to maintain it. Without the practice, costs drift back up within 12-18 months as new workloads get added without the same scrutiny. The business case should explicitly call out that the savings are run-rate, not one-time, and that maintaining them requires ongoing engineering attention.
4. Performance Gains: Latency, Reliability, Scale
Cost savings are the easiest bucket to put numbers on, but performance gains are often the bucket executives feel first — they just don't always connect the feeling to the optimization work that produced it.
The mechanism is straightforward. Optimization work that rightsizes workloads, tunes autoscaling, eliminates noisy-neighbor effects, and consolidates fragmented clusters produces three measurable performance outcomes: lower latency (especially p99), higher reliability (fewer cascading failures, better handling of traffic spikes), and better scale-on-demand behavior (faster cluster provisioning, faster autoscaling response). These are engineering metrics. Translating them into business metrics is where most proposals lose the executive.
A worked example, anonymized: a mid-market healthcare platform was experiencing intermittent p99 latency spikes during peak hours — the kind of issue that doesn't show up as "broken" in dashboards but shows up as customer-facing complaints and slow page loads during business-critical windows. The optimization work, primarily tuning resource requests/limits and consolidating three small clusters into one larger cluster with proper bin-packing, cut p99 latency from roughly 1.4 seconds to 350 milliseconds — about a 75% reduction. The business translation wasn't "p99 improved 75%." The business translation was: customer support ticket volume dropped roughly 30% during peak hours over the following quarter, and the engineering team stopped spending 4-6 hours per week on incident triage that had been routine. The first number touches customer retention. The second touches engineering capacity.
Reliability and scale-on-demand translate similarly — fewer incidents, fewer SLA penalties, the ability to absorb 5x normal traffic without paging engineers. For businesses with seasonal or event-driven traffic patterns (retail sales events, healthcare enrollment periods, financial services market open/close), the ability to absorb traffic spikes without manual intervention is worth a concrete dollar figure even if the optimization work itself doesn't add new features. The business case should quantify it: "How much revenue is at risk during a major traffic event, and how much engineering time is currently spent preparing for it?"
The CFO-friendly framing: performance gains are usually framed as risk reduction (avoided outages, avoided SLA penalties, avoided customer churn) and capacity unlock (the platform can now support growth without proportional cost increases). Both framings translate directly to financial outcomes, even when the underlying metrics are engineering ones.
The challenge with the performance bucket is that gains often don't show up in dashboards as a clean before/after. They show up as the absence of bad things — fewer incidents, fewer complaints, fewer 2 AM pages. The business case has to commit to measuring them post-hoc, because the CFO will not fund a proposal that promises "fewer bad things might happen." We'll come back to this measurement-plan requirement in section 7 on pitfalls.
5. Productivity: How Optimization Frees Engineering Time
The productivity bucket is consistently the largest of the three in absolute dollar terms, and the hardest to put clean numbers on. That's why most proposals either skip it or undersell it. Don't make that mistake — this is where the optimization work pays for itself fastest.
Every senior platform engineer carries an implicit operational tax on their time: capacity planning, node patching, version upgrades, debugging configuration drift, firefighting the cluster because someone deployed with the wrong requests/limits, the recurring "why is this pod pending" investigation, the quarterly disaster recovery drill that nobody has time for but everybody knows is overdue. None of those activities show up on a single ticket. They show up as the engineer's calendar being full of small, urgent, non-strategic work — and the strategic work (the migration that would unlock a new revenue line, the platform improvement that would unblock a product team, the architectural decision deferred three quarters in a row) not getting done.
Optimization work reduces this tax in three ways: it eliminates the work's source (right-sized workloads don't generate "why is this pod pending" investigations), consolidates the operational surface (fewer clusters means fewer upgrade windows, fewer on-call rotations), and produces documentation and patterns (runbooks, defaults, golden paths) that let junior engineers handle routine work without escalating.
A worked example, anonymized: a mid-sized SaaS platform running Kubernetes across three clusters and a fleet of approximately 40 nodes had three senior platform engineers whose calendars showed roughly 60-70% of their time on operational toil. After a six-month optimization engagement that consolidated to one cluster, codified golden-path Helm charts, and implemented proper GitOps deployment patterns, that number dropped to roughly 30-40% — a 25-30 percentage point reclaim on three engineers. At a fully-loaded cost of $250-300K per senior platform engineer, that's roughly $190-270K per year in reclaimed engineering capacity. The productivity gain alone paid for the optimization engagement in the first six months, before counting any cost or performance gains.
The CFO-friendly framing: productivity gains translate to either avoided hires (the same team produces more without growing) or accelerated roadmap (the same team produces more of the things that drive revenue). The first is capex avoidance — a $250K engineer you don't have to backfill in year two. The second is revenue acceleration — features that ship six months earlier because the team isn't spending those six months on toil.
The challenge with the productivity bucket is measurement — unlike cost or performance gains, productivity shows up as what the team did instead, which requires a baseline measurement before the optimization work starts. The recommended practice: have each senior engineer log their time in two buckets for the four weeks before the engagement begins ("operational toil" vs. "everything else"), then re-measure six months later. We'll come back to this measurement-plan requirement in section 7.
6. Building Your Business Case: The 5-Slide Deck
The previous sections sized the opportunity. This section gives you the structure to put it in front of an executive audience. The five-slide framework below is what we've seen work across multiple engagements, in multiple industries, for audiences ranging from CFOs who have never touched Kubernetes to CTOs who have. Each slide has a specific job; the deck as a whole tells a story that doesn't require the audience to remember technical detail to follow the conclusion.
Slide 1 — Current state (the "where we are today" baseline). Two numbers and one chart. The two numbers: total Kubernetes-attributable cloud spend over the last 12 months (monthly run-rate), and the team's current operational toil estimate (from the time-logging exercise in section 5). The chart: monthly cloud spend trend, with the trend line clearly visible. The point of this slide is to establish the magnitude of the current spend and the trajectory it's on. Most executives will see the trend line for the first time on this slide and immediately understand why the conversation is happening. Don't editorialize — let the chart do the work.
Slide 2 — The three-bucket opportunity sizing. Use the framework from section 2. For each bucket (cost, performance, productivity), give a conservative dollar range with the source of the range. Cost: based on the cluster utilization assessment and benchmarking against similar deployments. Performance: based on incident history and SLA penalty exposure. Productivity: based on the time-logging baseline from section 5. The point of this slide is to show that the opportunity is materially larger than the cost bucket alone — most executives have only ever seen the cost bucket. Sum the three ranges to show the total annual opportunity. Don't promise the high end of any range; promise the conservative end of each and let the actual delivery exceed it.
Slide 3 — Payback period, framed as a comparison. Optimization investment (engagement cost + internal team time) vs. annual run-rate savings. Most engagements land at a 6-12 month payback on the cost bucket alone, or 3-6 months when the productivity bucket is included. The point of this slide is to convert the opportunity from "how much could we save" to "how soon do we get the savings." A CFO will fund a project with a 6-month payback. They will defer a project with a 24-month payback. The difference is usually just how you present the buckets and whether you include productivity.
Slide 4 — The cost of inaction. The most underused slide in most business cases. The point isn't to scare the audience — it's to name the alternative. Two numbers: continued infrastructure cost growth over the next 12 months (extrapolate the trend from slide 1), and the cumulative engineering capacity that will be spent on operational toil if nothing changes (extrapolate from the time-logging baseline). These numbers are usually larger than the proposed optimization engagement cost, which is the point. The decision isn't "do this project or do nothing." It's "do this project or accept these trends as strategic facts."
Slide 5 — Recommendation and ask. One slide, one decision. The recommendation is what you'd do anyway as the engineering lead — the optimization engagement with the specific scope, timeline, and investment number. The ask is what you need from the room: budget approval, executive sponsorship for cross-team coordination, and a commitment to the measurement plan from sections 3 and 4 (post-engagement reporting on the actual delivered savings). Don't ask for more than those three things. A focused ask reads as confidence; a sprawling ask reads as scope creep.
The hidden slide: appendices. Budget for 8-15 pages of appendices that nobody reads in the meeting but exist for the questions that come up afterward. Common contents: cluster utilization assessment (full data), workload inventory with rightsizing recommendations, productivity time-logging baseline (anonymized), implementation plan (phased milestones, named owners), and references (case studies, benchmark sources, vendor evaluations). The appendices are the artifacts that survive the meeting — executives refer back to them when questions arise in the weeks after.
7. Common Pitfalls and How to Avoid Them
The patterns below account for most failed Kubernetes optimization proposals. We've seen each of them derail otherwise good work. None of them are exotic — they're the predictable mistakes that come from skipping steps or treating the work as a one-time project instead of an ongoing practice.
Pitfall 1: Leading with utilization metrics, not financial outcomes. "We'll improve cluster utilization from 22% to 65%" is an engineering outcome. The financial outcome is "we'll reduce Kubernetes-attributable cloud spend by 25-35%, freeing $X annually." If the proposal doesn't translate the engineering metric to a dollar figure with the methodology behind it, the CFO will not fund it. The fix: every engineering metric in the proposal needs a paired financial translation, with the source of the dollar conversion explicit.
Pitfall 2: Underestimating the migration cost. Optimization work touches everything — deployments, observability, security policies, autoscaling configurations, ingress, secrets management. Each touchpoint is a chance for something to break. The honest migration estimate includes a contingency buffer (we recommend 30%) for the issues you didn't anticipate, because there will be issues you didn't anticipate. Proposals that promise "90 days start to finish" without a contingency buffer usually fail at the 6-month mark when the contingency gets burned through and the project is half-done.
Pitfall 3: Ignoring the organizational change. Optimization work changes how the platform team operates, how application teams deploy, and how on-call rotations are staffed. These changes have a learning curve that shows up as a temporary productivity dip — usually 4-8 weeks — before the new patterns become routine. Proposals that don't budget for this dip (training time, slower deploys during transition, post-cutover bug triage) usually overrun on the people side, not the technical side. The fix: include an explicit "adoption period" in the implementation plan, with named owners for the change-management work, not just the technical work.
Pitfall 4: Treating it as a one-time project — and Pitfall 5: overpromising. Optimization work that delivers a 30% savings in year one without a maintenance practice will see costs drift back up by year three as new workloads get added without the same scrutiny. The proposal should explicitly call out the ongoing practice — what's the review cadence, who owns rightsizing decisions on new workloads, what's the tooling investment to keep dashboards current. Without it, the savings are a one-time event; with it, they compound year over year.
The fifth pitfall is the one that breaks trust fastest: promising more than the work can deliver. Vendor content is full of "50% savings in 30 days" claims that don't survive contact with reality. The honest ranges in this article (20-40% cost savings, 6-12 month payback, productivity gains measurable but not always predictable in advance) are the real numbers. Promising the high end and delivering the conservative end is the fastest way to lose executive trust on the next proposal, even when the work itself was successful.
8. When to Bring in External Help
The honest answer to "should we hire an outside consultancy or do this ourselves" is that both paths work, and the right choice depends on three factors that are specific to your organization.
When to do it yourself: You have at least one senior platform engineer who has done Kubernetes optimization work before, specifically the workload rightsizing + autoscaling + cluster consolidation cycle. You have 3-6 months of engineering capacity available without compromising the roadmap. You have executive trust to make platform decisions without constant justification. If all three are true, the work is well-understood enough that external help mostly accelerates what you could do anyway, and the savings on external cost may not justify the loss of internal ownership.
When external help pays for itself: You have senior platform engineers but none of them have done the optimization cycle end-to-end before. You have the capacity but the team's calendar is dominated by feature work and there's no internal champion for the optimization work to survive against competing priorities. You have executive trust but the executive team is skeptical of "platform team says we should spend 6 months on infrastructure" without external validation. In any of these cases, an external engagement that runs 8-16 weeks typically produces faster results than the internal path because the external team arrives with the patterns, the templates, and the executive-deck structure already in hand.
What external help actually buys you: Not headcount — three external consultants for 12 weeks is not three engineers for 12 weeks, because the external team has ramp-up time and knowledge transfer overhead. What you're buying is pattern recognition: the external team has seen the "underutilized workloads with over-broad requests/limits" pattern across 20 deployments and can identify it in your cluster in week one instead of week six. You're also buying the executive-deck structure from section 6 — a consultancy that has done this work has a refined business case template that has already been through executive review cycles, which is faster than building one from scratch. The work needs internal ownership after the engagement ends, or it decays; the proposal should explicitly call out the transition plan and named owners.
9. FAQ: Kubernetes Optimization Business Case
What's the typical ROI on Kubernetes optimization?
For a mid-sized deployment (50-200 nodes, multi-cluster), expect 20-40% run-rate reduction on Kubernetes-attributable cloud spend over a 6-12 month period, with the higher end achievable only when starting state has significant over-provisioning. Productivity gains are typically the largest bucket in absolute dollar terms — $190-270K/year in reclaimed senior engineering capacity is a representative range — but require a baseline time-logging exercise to measure credibly. Performance gains vary widely by starting state. Plan for the conservative end of each bucket; deliver the middle; let actual results exceed expectations.
How do you build a business case for K8s cost work?
Use the five-slide framework in section 6. The structure is: current state (spend trend + toil baseline), three-bucket opportunity sizing (cost + performance + productivity), payback period comparison, cost of inaction, and a focused recommendation with three asks. The deck tells the story in the structure; the presenter fills in the nuance. The appendices (cluster utilization assessment, workload inventory, time-logging baseline, implementation plan, references) survive the meeting and get referenced in the weeks after.
What metrics do CFOs care about for Kubernetes spend?
Three, in order of how often they come up: (1) total monthly run-rate cloud spend attributable to Kubernetes and the trend line over the last 12 months; (2) payback period on the optimization engagement, framed as investment vs. annual run-rate savings; (3) total annual opportunity sized across the three buckets, not just the cost bucket. The cost-of-inaction framing — what happens if nothing changes over the next 12 months — is the metric that closes the budget conversation most consistently.
How long does Kubernetes cost optimization take to pay back?
Most engagements land at 6-12 months payback on the cost bucket alone, or 3-6 months when the productivity bucket is included. The variance is driven primarily by the engagement cost (internal team time vs. external consultancy) and the size of the productivity opportunity (which depends on team size and current operational toil). External engagements typically run 8-16 weeks of active work, with 6-9 months of measurement and refinement after. The payback period should be presented in the proposal as a range, with the methodology behind both ends of the range explicit.
10. Conclusion: From Business Case to Implementation
The work of building a business case is mostly the work of translating — engineering outcomes to financial outcomes, technical metrics to executive metrics, three ROI buckets into one coherent story. The framework in this article is the translation structure. The specific numbers in any given business case are yours to fill in, with the methodology behind them visible to the executive audience.
Three things to take into your next conversation about this work: lead with the three buckets, not the cost alone; build the deck, not the document; and name the cost of inaction. Each of those choices separates the proposals that get funded from the proposals that get politely tabled.
If you're building the business case right now, the deck template in section 6 is your starting point. The worked examples throughout this article are anonymized but representative; substitute your own numbers and you have a complete first draft.
If you want a second opinion on the opportunity sizing or the implementation path, THNKBIG runs a free Assessment Workshop — a focused 2-hour session where we walk through your specific deployment and give you a concrete baseline + recommendation. No obligation, no follow-up pressure. The workshop exists because the business case is usually the hardest part of the optimization work, and most teams benefit from a sanity check on the opportunity sizing before they commit to the engagement.
Explore Our Solutions
Related Reading

Image Registry Snowed In: What You Need to Know About the k8s.gcr.io Freeze
Prepare for the Kubernetes image registry migration from k8s.gcr.io to registry.k8s.io. Timeline, impact assessment, and migration steps.
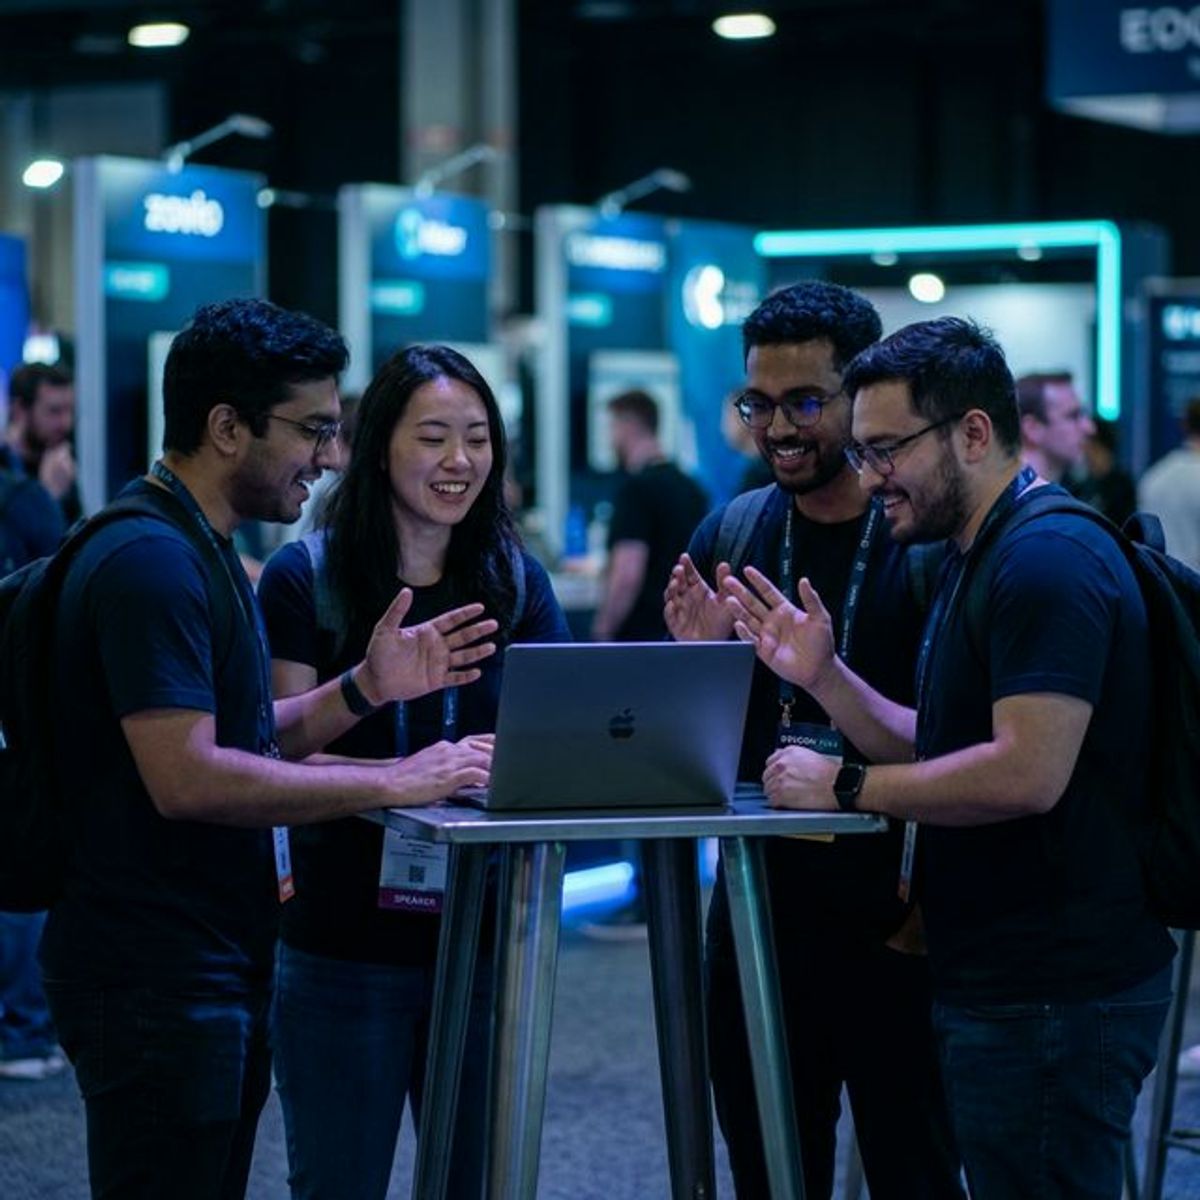
KubeCon 2022 Recap: Insights from the Kubernetes Community

Observability vs Data Governance: A Strategic Insight for IT and Cloud Operations Leadership
THNKBIG Team
Engineering Insights
Expert infrastructure engineers at THNKBIG, specializing in Kubernetes, cloud platforms, and AI/ML operations.
Ready to make AI operational?
Whether you're planning GPU infrastructure, stabilizing Kubernetes, or moving AI workloads into production — we'll assess where you are and what it takes to get there.
US-based team · All US citizens · Continental United States only